Let’s go over your Qix analytics! We made it simple and easy for your firm to understand your clients and business growth through your Qix Dashboard! Read and follow these steps carefully.
Finding your metrics:
- Sign in to your Qix Back-office site
- Click “Dashboard”

3. On the Dashboard, you will find various boxes including your firm’s analytics!
Language ID Chart:
- This pie chart will detail which language preferences your clients use. The chart shows the following languages: English, Spanish, and French.

Hover over the various pieces of the pie chart and the details will show up in the center accordingly.

“This Month” Analytics Section:
- Each month, this section will detail how many new contacts, appointments, and impressions your firm accumulated.
- This section is useful for firms that wish to know exactly how much traffic comes through their business on a monthly basis. The section is dynamic and will update automatically, no necessary steps on your part.

Business Overview:
- The “Business Overview” chart portrays new contacts created and appointments created on a two-week time series basis.
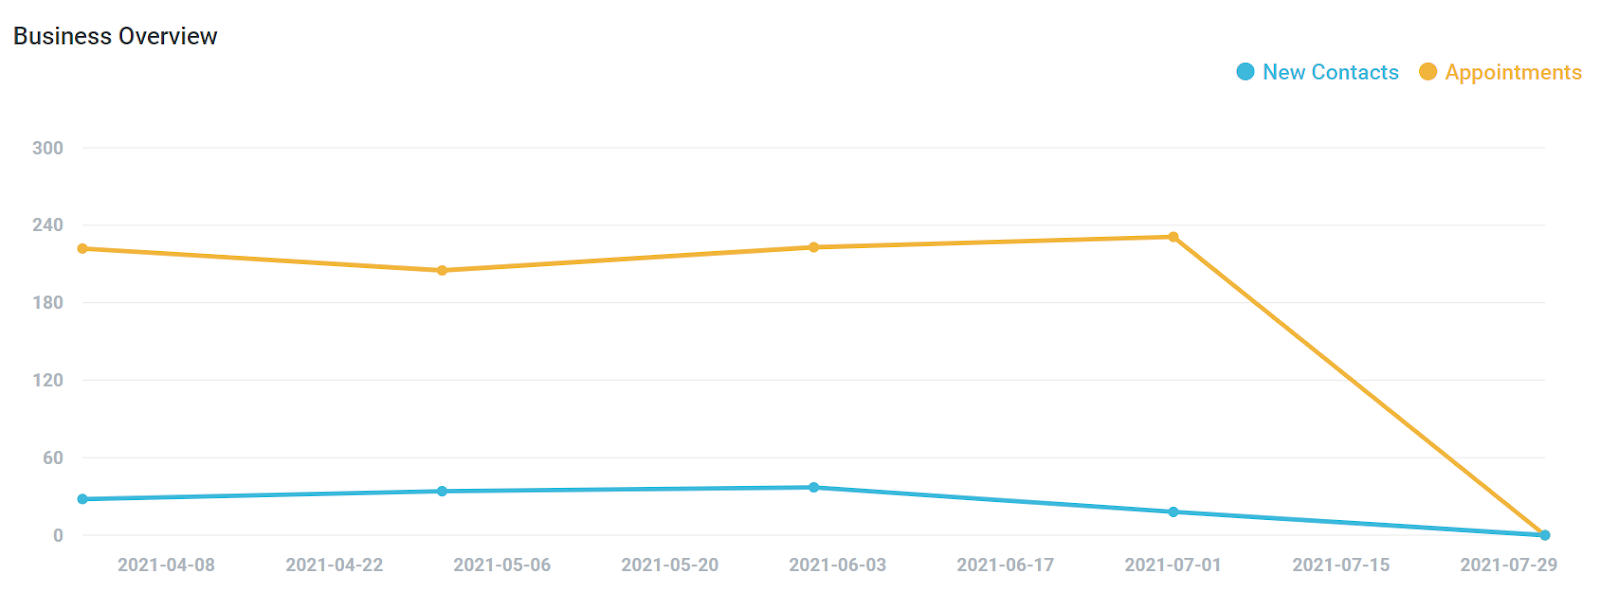
This chart provides a clean and simple way to show others how your business is currently doing.
Booking & Traffic:
Booking shows the specific amount of appointments created using the “Booking” plugin in Qix.
NOTE: You can find this plugin by clicking “Plugins” in the left side-bar and navigating to the “Bookings” icon.

“Traffic” shows the total amount of clicks/visits across all platforms connected with Qix (website, app, etc.)
NOTE: Take a look at the % change from the previous month, you may find that your traffic has increased!

Check-Ins:
- If your firm has chosen to install a Qix Check-In Kiosk into your lobby, the total amount of physical check-ins will be listed here.

Interested in getting a Qix Kiosk for your firm? Contact your Qix Sales Representative!
Total Contacts:
Want to know how many clients/contacts your firm has in total? Simply check the details in “Total Contacts.”
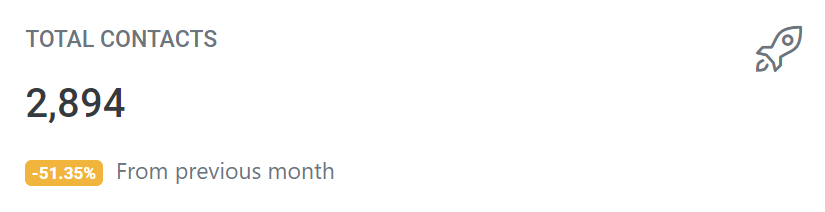
Make sure to check the % change from the previous month to see if your client-base is increasing!
4. You can also view other useful metrics in Manager! Navigate to Manager and click the “Marketing” tab.

A. Click “Analytics”

B. Click the various tab options to determine the variety in your client’s ages, locations, and languages.

C. Click Link Clicks and a specific Qix campaign you launched to see how many clicks that specific marketing message received.

One of our core missions at Qix is to provide every business with tools that allow for the flourishing of your business and better communication with your clients. Please use the metrics provided to understand your business and its growth rate. Getting to know your clients is key to forming a strong, long-lasting relationship. Your Qix suite will help you along the way.
For more information, posts, and tutorials visit: https://qix.cloud/documentation/
Leave a Reply